
 Data Science
Frax: Fractional-Algorithmic Stable Coin Risk Modeling

David Fake


Frax: Fractional-Algorithmic Stable Coin Risk Modeling
The stable coin FRAX is the first and only stablecoin backed by a mix of collateral and algorithmic supply aptly named Frax deriving from the clever portmanteau of fractional-algorithmic.
- The FRAX stablecoin targets a tight band around $1/coin
- Frax Share (FXS) is the governance token of the entire Frax ecosystem of smart contracts which accrues fees, seigniorage revenue, and excess collateral value.
Frax is in its own category as all of the other stablecoin models have been entirely algorithmic and back by reserves like UST or TRON, overcollateralized by crypto collateral like DAI is by ETH, or 100% redeemable for fiat dollars like USDC or USDT. Frax is fractionally collateralized (targets 80-94% collateral ratio depending on market conditions) and incentives arbitrageurs to maintain the required minimum collateral ratio and $1/coin peg algorithmically.
While there are a few dashboards on activity and summary analytics of Frax and other stable coins, we know of no risk models or risk frameworks for any stablecoin. As we foray deeper into DeFi risk modeling, Irulast has developed a summary risk dashboard for Frax collateralization exposures.
FRAX Collateralization Risk Dashboard
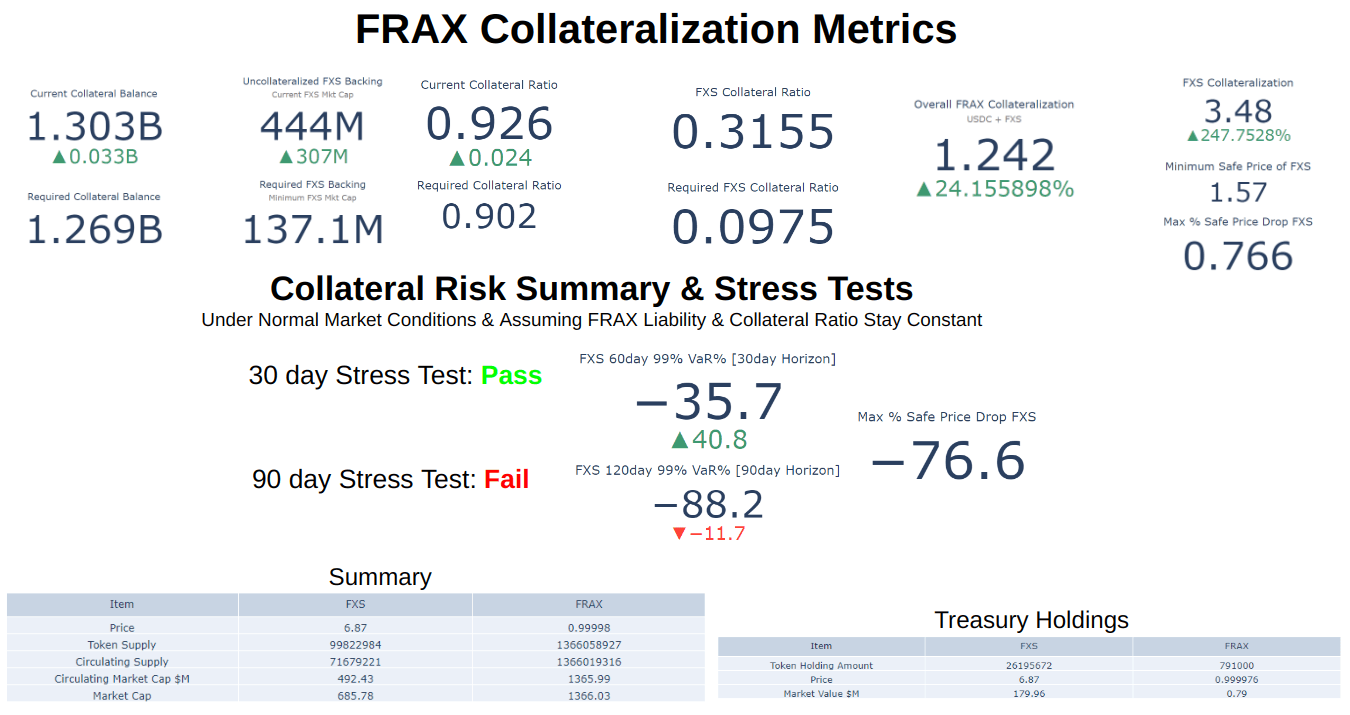
The Irulast Frax Collateralization dashboard summarizes the collateralization metrics and runs a VaR model which estimates the probability of Frax being able to fully meet its liabilities at any point in time for any forward looking horizon.
The initial implementation incorporates a stress test which quantifies if there is less than a 1% chance of Frax able to fully meet its liability over a 1 and 3 month time horizons assuming no changes in liability or collateral ratio (which are big assumptions) but can be refined by incorporating a scenario analysis framework in the further analysis.
Some of the key risk measures are the overall Frax Collateralization, the Max % Safe Price drop of FXS, and the VaR stress tests which quantify a 99% confidence for the maximum likely price drop of FXS to meet all Frax liabilities over a set time horizon. For these measures, FXS market cap would cover the non-collateralized portion of Frax as part of Overall Frax collateralization. As can be seen from the Frax Collateralization dashboard below the 90day Horizon stress test fails because the VaR of -88% is greater than the max Safe Price drop of -76.6%.
As a comparison and validation, the collateralization metrics and VaR models as of Apr 20, 2022 (before the Terra UST collapse) are detailed below to determine how the risk exposures have changed over the past few months.

Comparing collateralization metrics from July to April, there was a significant deterioration in the Overall Frax Collateralization from 175% to 124%, and the Frax treasury as well which was dominated by FXS. The other change is the decrease in Max % Safe Price drop of FXS from 85% to 76%, and the massive increase in VaR in July driven by the 85% price drop of FXS from April into May. In response the collateral ratio was also increased.
In summary overall risk exposures have increased, although Frax is still in a healthy risk position with many levers to manage risk and net over collateralized.
This sort of risk modeling framework can help guide decisions for protocols and manage and monitor risk exposures. As an example, it could help determine the Required Collateral Ratio by setting risk tolerance limits and having a modeling driven approach to strategic decisions and managing overall risk exposures depending on market conditions and risk premia.
DeFi Treasury Portfolios Highly Correlated to Protocol Growth
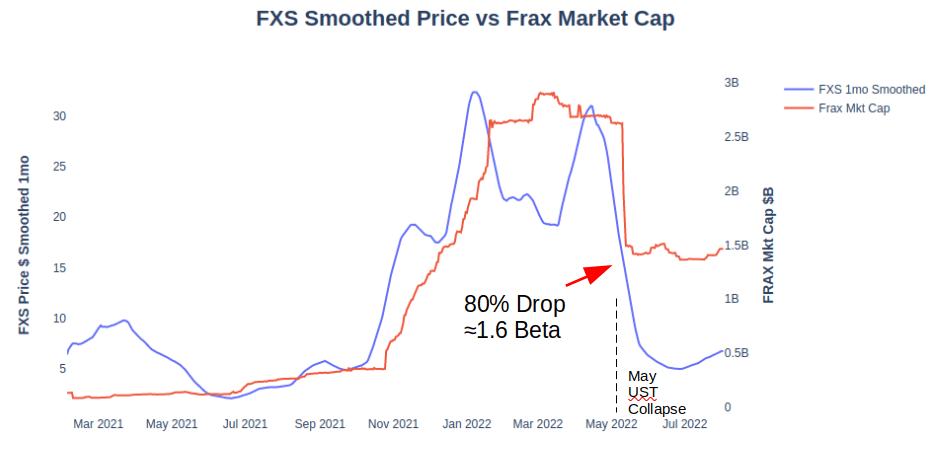
Another potential area of further risk analysis is the high Beta of FXS relative to the FRAX market cap (overall liability) and the high percentage of Frax treasury dominated by FXS, the governance token.
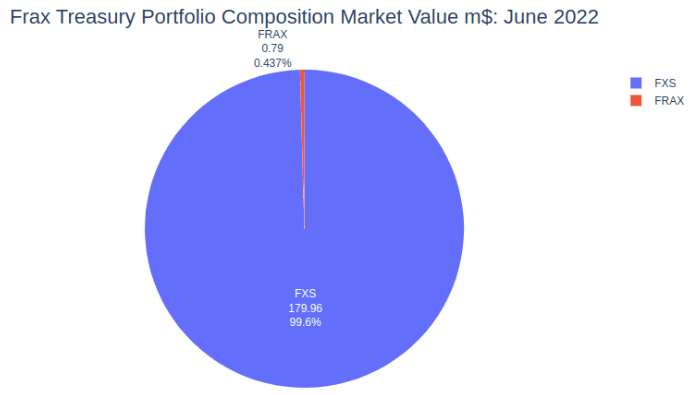
During the UST meltdown in May, the overall Frax market capitalization declined from $2.6b to $1.4b accounting nearly a 50% drop, yet the FXS price declined from $35 to $6 almost 80%, indicating a very high Beta of FXS to FRAX Market Cap of around 1.6. In the plot below we’ve smoothed FXS price for one month to better distill a signal, and the relationship to the Frax Market Cap.
From a risk diversification perspective, ideally you want a treasury portfolio to have little to no correlation to the underlying business to cover unexpected losses and to lower overall risk exposure. This is called economic capital management. Ideally your treasury portfolio should have a Beta of close to 0 relative to the liability, a Beta greater than 1 implies you’re highly exposed to a runaway risk event, which should be concerning.
As part of a contingency funding plan framework for market stress scenarios that might be needed to cover the liability, diversifying some portion of treasury into other assets that are not correlated to the Frax liability (market cap) would strengthen the overall risk profile of Frax, especially if it’s ever needed to intervene during times of market stress.
DeFi Risk Amplified Compared to TradFi
A challenge for many crypto DAO’s and protocols is they generally want to hold a large amount of their governance token to maintain control and have voting power. The downside is their treasury portfolio can therefore be highly exposed and levered to the growth of the business, which can have the effect of compounding risk, this is especially true when compared to overall risk in TradFi.
As a comparison, traditional banks also have fractional reserves, and a treasury portfolio that is primarily made up of cash assets and short term bonds whose value is independent of the bank's depositors behavior. In the event of a run on the bank, when depositors withdraw money, the treasury portfolio value stays the same.
However, in crypto, the opposite happens as the governance token prices are always highly correlated to the growth of the protocol. This results in both positive and negative risk feedback. When protocol growth increases and crypto prices increase, the overall risk is exponentially lower, but when protocol growth drops and crypto prices drop, overall risk is exponentially greater.
In addition, crypto prices are generally highly correlated over longer time frames, and especially during market shocks, which also significantly decreases the diversification benefit and amplifies risk (more on that in the future). Even if a protocol maintains a large portion of their treasury or reserves in other cryptos, they’re likely not as diversified as they may believe. We precisely saw this happen with the UST collapse in May where the Terra foundation had the majority of their reserves in bitcoin. Once they started selling their bitcoin collateral to maintain the UST peg, it precipitated a large collapse in the crypto market and dropped the BTC price from around $40k to $30k.
BTC Price: March - June 2022

This is why you need to avoid linear thinking and employ scenario analysis and stress testing, and yet another reason for even a greater urgency in implementing sound risk management frameworks in DeFi space as overall risk is amplified everywhere we look.
Conclusion
In a previous post we highlighted the need in DeFi for sound risk management and modeling techniques going forward, given the new lower growth regime and bear market which will likely be here for a while. These risk models and frameworks should be used to properly identify risk exposures, manage and mitigate them, and ideally open source to give further validation.
We’ve only touched on a small portion of a DeFi risk profile in this analysis. Some of the other major categories of risk modeling include: liquidity risk, ALM (Asset Liability Mismatch), economic capital modeling, credit risk, operational risk, scenario analysis and stress testing.
However, as we’re uncovering as we dive deeper into DeFi risk modeling, a straight application of these modeling frameworks from traditional finance is not necessarily valid, as DeFi risk exposures are actually much greater. To build sound DeFi risk models and risk management processes they will need to be built from the ground up using first principles approaches.
Risk Management Terms
The goal of liquidity stress testing is to analyze if you can withstand unexpected market disruptions.
A contingency funding plan (CFP) is needed to address liquidity needs under stress and incorporate quantitative information generated during the liquidity stress testing process.
Scenario analysis: Forward-looking scenarios to accurately reflect real market conditions, and incorporate custom financial, behavioral, and economic variables according to the funding and liquidity profile.
Surplus funding capacity: Amount of capacity that exists after taking into account the headroom required to survive a stress event (whether specific to a protocol or market-wide).